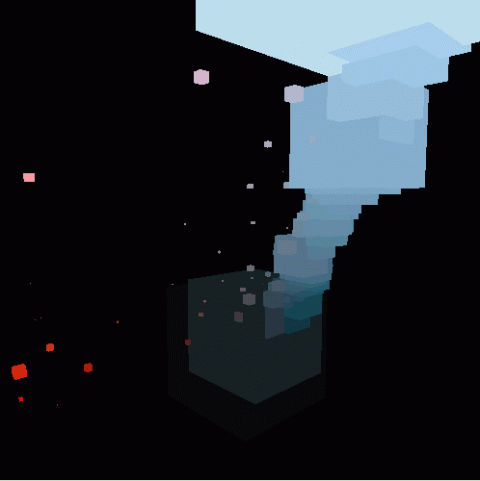
Computed visualization, by Greg Fraser, based on data found in digital images: The rgb-value from every pixel found in an image is read and stored. The collected information is visualized by mapping the three values of red, green and blue on to the x, y and z-axis, thus placing a particular color-value into a 3dimensional space. Dependent on the amount of pixels sharing the same rgb-value, a box is drawn at that location, it’s size representing the quantity.
